State of Experimentation
The 2026 report on how product teams test, ship and learn, drawn from 1,400 teams and 3.2 million experiments.
The headlines
Key findings
Most tests do not win
Fewer than four in ten experiments produce a clear winner. Teams that expect this keep running tests. Teams that do not expect it stop.
Guardrails raise velocity
Teams with automatic guardrails run more than twice as many tests. Safety checks removed the fear that slowed everyone else down.
Flag debt is everywhere
Most flags outlive their purpose. Teams with expiry dates and owners carry a third as many stale flags.
Readouts are the bottleneck
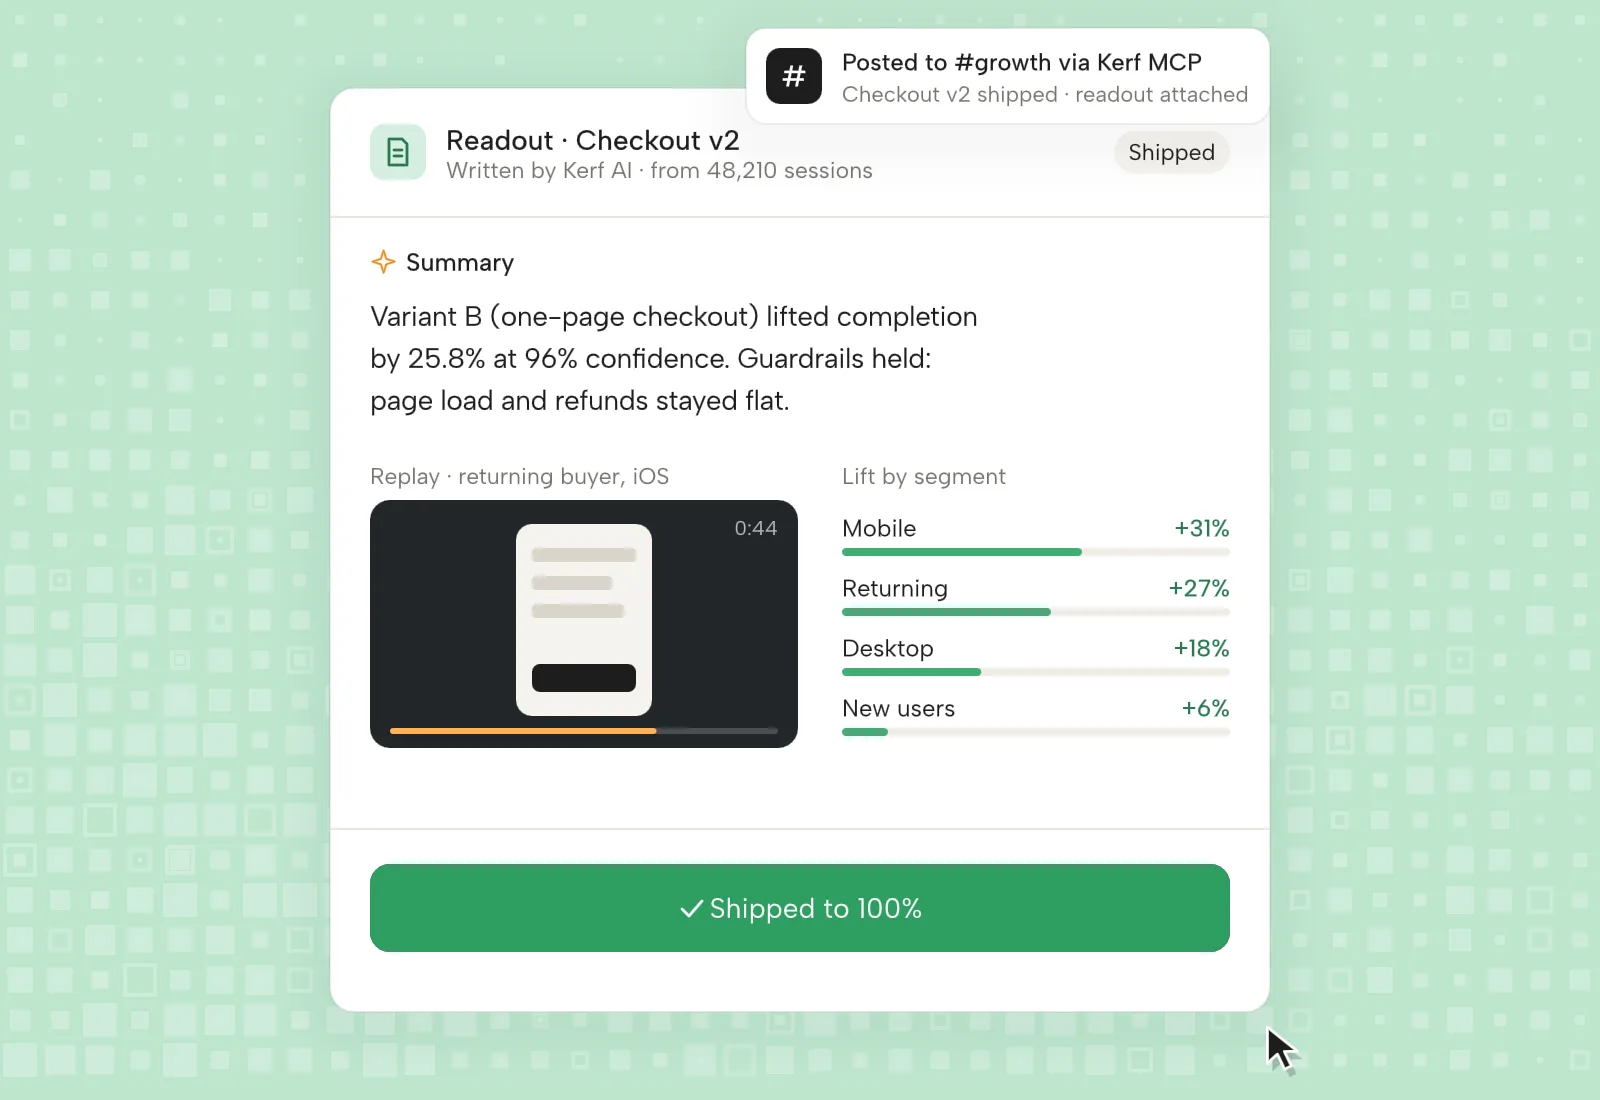
The slowest step in a test is writing it up. Teams that automate summaries decide faster and read more of their own results.
Holdouts are rare and valuable
Only one in seven teams keeps a long running holdout. Those that do report far more confidence in their program's impact.
Warehouse metrics end arguments
Teams that compute metrics in their warehouse report fewer disputes about whose numbers are right.
What the best programs share
We compared the top quarter of teams by shipped wins per engineer to everyone else. The gap was not budget or headcount. It was habit.
- They write the hypothesis and the metric before they write code.
- They size every test and do not peek.
- They close flat tests with a written reason.
- They clean up flags in the same sprint a test ends.

“The report confirmed what we suspected. Our problem was never ideas. It was how long it took to find out which ones worked.”